Developer: | N/A |
Architect: | N/A |
Builder: | N/A |
Year Built: | 2004 |
Number of Units: | 386 |
Number of Units For Sale: | |
Unit Sizes: | From 683 to 3337 s.f. |
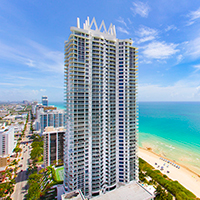
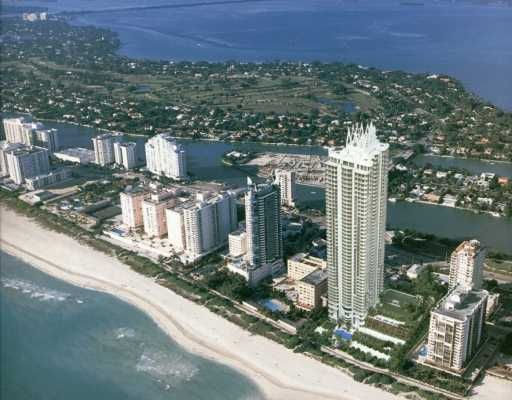
Akoya is one of the rarest of cultured pearls and is a perfectly appropriate namesake for the third tallest building in Miami Beach. The Akoya is known for its luxury and elegance and contains some of the most beautiful Miami homes in the area. The development is located on prime beachfront property, nestled between the world class shopping of Bal Harbour and the exciting night life of South Beach. The Akoya is deemed as one of the most prestigious addresses in the North Beach area.
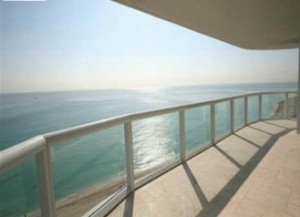
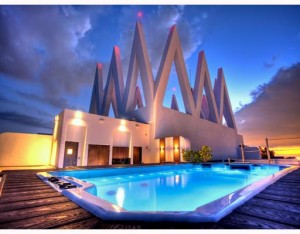
Located at 6365 Collins Avenue in Miami Beach, Florida, The Akoya was constructed in 2004 and is comprised of 386 units. The building was designed by Brito, Cohan and Associates and developed by Merco Group International. It is the third tallest building and the tallest condo building in Miami Beach. The building features top-of-the-line Miami homes with luxurious features and designer finishes. Prices range from $300,000s to over $3 million.
In addition, pets are welcome at The Akoya. Residents can have one dog up to 50 pounds, or two dogs or two cats which can weigh up to 40 pounds combined when fully grown.
North Beach is home to several festivals throughout the year that bring fun and excitement to area residents. The North Beach Arts Festival gives locals the chance to meet area artists and purchase their work. The ArtDeco amphitheatre in the heart of North Beach hosts several concerts and other live shows in the bandshell thought the year. The Bal Harbour Shops and Aventura Mall are nearby and provide residents with a wide variety of shops and boutiques. And of course adjacent South Beach is where all the locals go to experience the glitz and glamour of Miami Beach nightlife.
North Beach is a very accessible part of town. On the north side of the area is the Julia Tuttle Causeway that leads to Downtown Miami, the airport and Interstate 95. 71st Street runs right through the middle of the area and leads to North Bay Village as well as Interstate 95. A quick car drive north on Collins Avenue takes you to Surfside, the Bay Harbor Islands, Bal Harbour, Sunny Isles and Aventura. The Akoya is just 20 minutes from the Miami International Airport and cruise port.
Unit | Price | List $/sqft | Beds/ Baths | Interior Space | Listing Date | ||
---|---|---|---|---|---|---|---|
806 | $739,000 | $915 | 1/1½ | 808 s.f. | 7/29/2024 | ||
11.8% | 911 | $750,000 | $928 | 1/1½ | 808 s.f. | 7/27/2024 | |
6.2% | 1711 | $760,000 | $941 | 1/1½ | 808 s.f. | 5/12/2023 |
Unit | Price | List $/sqft | Beds/ Baths | Interior Space | Listing Date | ||
---|---|---|---|---|---|---|---|
4.0% | 907 | $1,199,000 | $907 | 2/2 | 1322 s.f. | 5/19/2023 | |
7.5% | 1507 | $1,290,000 | $976 | 2/2 | 1322 s.f. | 6/3/2024 | |
9.7% | 3904 | $1,350,000 | $1,173 | 2/2 | 1151 s.f. | 6/10/2024 | |
3909 | $1,550,000 | $1,347 | 2/2 | 1151 s.f. | 10/21/2024 | ||
1008 | $1,600,000 | $1,210 | 2/2 | 1322 s.f. | 11/17/2024 | ||
10.0% | 1408 | $1,650,000 | $1,248 | 2/2 | 1322 s.f. | 3/7/2024 | |
2.9% | 4008 | $1,650,000 | $1,248 | 2/2 | 1322 s.f. | 8/3/2024 | |
4.8% | 4408 | $1,799,000 | $1,361 | 2/2 | 1322 s.f. | 7/21/2024 |
Unit | Price | Sold Price | Sold $/sqft | Beds/ Baths | Interior Space | Sold Date | |
---|---|---|---|---|---|---|---|
4007 | $1,850,000 | Pending | Pending | 2/2½ | 1322 s.f. | 10/31/2024 | |
1602 | $1,645,000 | Pending | Pending | 2/2½ | 1392 s.f. | 11/11/2024 |
Unit | Price | Sold Price | Sold $/sqft | Beds/ Baths | Interior Space | Sold Date | ||
---|---|---|---|---|---|---|---|---|
5.5% | 2102 | $1,795,000 | $1,750,000 | $1,257 | 2/2½ | 1392 s.f. | 5/17/2024 | |
5.9% | 1102 | $1,599,000 | $1,500,000 | $1,078 | 2/2 | 1392 s.f. | 4/19/2024 | |
5.0% | 2602 | $1,805,009 | $1,600,000 | $1,149 | 2/2½ | 1392 s.f. | 4/8/2024 | |
2808 | $1,690,000 | $1,500,000 | $1,135 | 2/2½ | 1322 s.f. | 3/20/2024 | ||
2.7% | 1808 | $1,595,000 | $1,465,000 | $1,108 | 2/2½ | 1322 s.f. | 2/14/2024 | |
2407 | $2,095,000 | $1,875,000 | $1,418 | 2/2½ | 1322 s.f. | 1/16/2024 | ||
3.0% | 1506 | $777,000 | $770,000 | $953 | 1/1½ | 808 s.f. | 12/4/2023 | |
2311 | $779,000 | $725,000 | $897 | 1/1½ | 808 s.f. | 12/4/2023 | ||
2007 | $1,360,000 | $1,360,000 | $1,029 | 2/2½ | 1322 s.f. | 11/14/2023 | ||
3901 | $2,760,000 | $2,680,000 | $1,522 | 3/2½ | 1761 s.f. | 8/31/2023 | ||
3501 | $2,849,000 | $2,849,000 | $1,618 | 3/2½ | 1761 s.f. | 8/15/2023 | ||
2503 | $2,750,000 | $2,650,000 | $1,505 | 3/2½ | 1761 s.f. | 5/8/2023 | ||
1.3% | 2505 | $836,000 | $750,000 | $1,098 | 1/1½ | 683 s.f. | 5/2/2023 | |
911 | $749,000 | $700,000 | $866 | 1/1½ | 808 s.f. | 3/31/2023 | ||
11.2% | CAB24 | $395,000 | $395,000 | $1,756 | 0/1½ | 225 s.f. | 3/27/2023 | |
2504 | $895,000 | $895,000 | $1,108 | 1/1½ | 808 s.f. | 3/14/2023 | ||
2901 | $2,750,000 | $2,398,000 | $1,362 | 3/2½ | 1761 s.f. | 3/4/2023 | ||
1805 | $649,000 | $640,000 | $937 | 1/1½ | 683 s.f. | 3/1/2023 | ||
3911 | $1,450,000 | $1,275,000 | $1,108 | 2/2½ | 1151 s.f. | 2/27/2023 | ||
1909 | $690,000 | $685,000 | $848 | 1/1½ | 808 s.f. | 10/27/2022 | ||
3501 | $2,195,000 | $2,150,000 | $1,221 | 3/2½ | 1761 s.f. | 10/7/2022 | ||
2811 | $690,000 | $680,000 | $842 | 1/1½ | 808 s.f. | 9/23/2022 | ||
6.9% | 1211 | $695,000 | $695,000 | $860 | 1/1½ | 808 s.f. | 9/23/2022 | |
1201 | $2,500,000 | $2,500,000 | $1,420 | 3/2½ | 1761 s.f. | 9/16/2022 | ||
3.8% | 2008 | $1,299,000 | $1,250,000 | $946 | 2/2½ | 1322 s.f. | 9/1/2022 | |
3303 | $2,299,999 | $2,150,000 | $1,221 | 3/2½ | 1761 s.f. | 8/29/2022 | ||
3507 | $1,400,000 | $1,400,000 | $1,059 | 2/2½ | 1322 s.f. | 7/11/2022 | ||
2206 | $715,000 | $705,000 | $873 | 1/1½ | 808 s.f. | 6/23/2022 | ||
6.7% | 1102 | $1,400,000 | $1,405,000 | $1,009 | 2/2½ | 1392 s.f. | 6/3/2022 | |
5.8% | 2711 | $725,000 | $710,000 | $879 | 1/1½ | 808 s.f. | 6/2/2022 | |
1904 | $719,000 | $719,000 | $890 | 1/1½ | 808 s.f. | 5/18/2022 | ||
2005 | $550,000 | $533,500 | $781 | 1/1½ | 683 s.f. | 5/17/2022 | ||
7.1% | 4407 | $1,625,000 | $1,525,000 | $1,154 | 2/2½ | 1322 s.f. | 5/16/2022 | |
1807 | $1,295,000 | $1,295,000 | $980 | 2/2½ | 1322 s.f. | 5/2/2022 | ||
3906 | $899,000 | $899,000 | $781 | 1/2½ | 1151 s.f. | 4/29/2022 | ||
805 | $510,000 | $497,000 | $728 | 1/1½ | 683 s.f. | 4/8/2022 | ||
2311 | $680,000 | $635,000 | $786 | 1/1½ | 808 s.f. | 3/18/2022 | ||
807 | $950,000 | $950,000 | $719 | 2/2½ | 1322 s.f. | 3/17/2022 | ||
99,900.0% | 4409 | $1,000,000 | $1,000,000 | $869 | 1/2½ | 1151 s.f. | 3/16/2022 | |
1606 | $675,000 | $660,000 | $817 | 1/1½ | 808 s.f. | 3/15/2022 | ||
2107 | $1,350,000 | $1,280,000 | $968 | 2/2½ | 1322 s.f. | 3/4/2022 | ||
1.5% | 2506 | $670,000 | $680,000 | $842 | 1/1½ | 808 s.f. | 3/3/2022 | |
3208 | $1,399,000 | $1,350,000 | $1,021 | 2/2½ | 1322 s.f. | 3/2/2022 | ||
3807 | $1,550,000 | $1,725,000 | $1,305 | 2/2½ | 1322 s.f. | 2/18/2022 | ||
2804 | $660,000 | $650,000 | $804 | 1/1½ | 808 s.f. | 2/16/2022 | ||
8.7% | 2602 | $1,495,000 | $1,450,000 | $1,042 | 2/2½ | 1392 s.f. | 2/7/2022 | |
6.5% | 2406 | $650,000 | $635,000 | $786 | 1/1½ | 808 s.f. | 1/20/2022 | |
0.6% | 1905 | $529,452 | $525,000 | $769 | 1/1½ | 683 s.f. | 1/20/2022 | |
2108 | $1,250,000 | $1,200,000 | $908 | 2/2½ | 1322 s.f. | 12/29/2021 | ||
4501 | $2,299,000 | $2,170,000 | $1,232 | 3/2½ | 1761 s.f. | 12/9/2021 | ||
2309 | $595,000 | $580,000 | $718 | 1/1½ | 808 s.f. | 10/27/2021 | ||
3007 | $1,399,500 | $1,150,000 | $870 | 2/2½ | 1322 s.f. | 10/13/2021 | ||
1706 | $590,000 | $550,000 | $681 | 1/1½ | 808 s.f. | 9/27/2021 | ||
6.4% | 3010 | $585,000 | $550,000 | $805 | 1/1½ | 683 s.f. | 9/24/2021 | |
3.0% | 2306 | $639,000 | $609,000 | $754 | 1/1½ | 808 s.f. | 9/24/2021 | |
2710 | $485,000 | $475,000 | $695 | 1/1½ | 683 s.f. | 8/23/2021 | ||
9.2% | 1711 | $650,000 | $595,000 | $736 | 1/1½ | 808 s.f. | 7/30/2021 | |
6.3% | 3006 | $680,000 | $660,000 | $817 | 1/1½ | 808 s.f. | 7/20/2021 | |
906 | $490,000 | $480,000 | $594 | 1/1½ | 808 s.f. | 7/19/2021 | ||
2405 | $475,000 | $475,000 | $695 | 1/1½ | 683 s.f. | 7/15/2021 | ||
4207 | $1,299,000 | $1,280,000 | $968 | 2/2½ | 1322 s.f. | 7/14/2021 | ||
1.1% | 1108 | $889,000 | $875,000 | $662 | 2/2½ | 1322 s.f. | 7/2/2021 | |
1.1% | 808 | $829,000 | $810,000 | $613 | 2/2½ | 1322 s.f. | 6/18/2021 | |
3802 | $1,175,000 | $1,150,000 | $826 | 2/2½ | 1392 s.f. | 6/14/2021 | ||
4107 | $1,250,000 | $1,180,000 | $893 | 2/2½ | 1322 s.f. | 6/14/2021 | ||
0.7% | 1804 | $545,000 | $535,000 | $662 | 1/1½ | 808 s.f. | 6/2/2021 | |
2411 | $550,000 | $550,000 | $681 | 1/1½ | 808 s.f. | 5/28/2021 | ||
3301 | $1,850,000 | $1,850,000 | $1,051 | 3/2½ | 1761 s.f. | 5/26/2021 | ||
1.8% | 2909 | $550,000 | $510,000 | $631 | 1/1½ | 808 s.f. | 4/23/2021 | |
1.6% | 2501 | $1,525,000 | $1,375,000 | $781 | 3/2½ | 1761 s.f. | 4/21/2021 | |
2809 | $478,400 | $480,000 | $594 | 1/1½ | 808 s.f. | 3/18/2021 | ||
3504 | $746,500 | $725,000 | $630 | 1/2½ | 1151 s.f. | 3/16/2021 | ||
2311 | $530,000 | $510,000 | $631 | 1/1½ | 808 s.f. | 3/5/2021 | ||
806 | $428,000 | $400,000 | $495 | 1/1½ | 808 s.f. | 3/3/2021 | ||
4301 | $1,693,000 | $1,634,000 | $928 | 3/2½ | 1761 s.f. | 2/26/2021 | ||
2.6% | 4509 | $750,000 | $700,000 | $608 | 1/2½ | 1151 s.f. | 2/22/2021 | |
2604 | $524,900 | $480,000 | $594 | 1/1½ | 808 s.f. | 12/23/2020 | ||
3901 | $1,695,000 | $1,400,000 | $795 | 3/2½ | 1761 s.f. | 12/16/2020 | ||
2103 | $1,550,000 | $1,400,000 | $795 | 3/2½ | 1761 s.f. | 12/16/2020 | ||
3.7% | 3308 | $1,050,000 | $865,000 | $654 | 2/2½ | 1322 s.f. | 11/16/2020 | |
TS-01 | $5,950,000 | $4,100,000 | $1,214 | 3/3½ | 3377 s.f. | 11/13/2020 | ||
1911 | $478,000 | $400,000 | $495 | 1/1½ | 808 s.f. | 11/12/2020 | ||
0.1% | 1603 | $1,495,452 | $1,400,000 | $795 | 3/2½ | 1761 s.f. | 10/30/2020 | |
2803 | $1,700,000 | $1,460,000 | $829 | 3/2½ | 1761 s.f. | 9/29/2020 | ||
1201 | $1,249,000 | $1,190,000 | $676 | 3/2½ | 1761 s.f. | 9/21/2020 | ||
3606 | $800,000 | $735,000 | $639 | 1/2½ | 1151 s.f. | 9/8/2020 | ||
2.6% | 1405 | $380,000 | $365,000 | $534 | 1/1½ | 683 s.f. | 9/2/2020 | |
3.5% | 2810 | $385,000 | $362,000 | $530 | 1/1½ | 683 s.f. | 8/7/2020 | |
14.4% | 2107 | $890,000 | $880,000 | $666 | 2/2½ | 1322 s.f. | 8/4/2020 | |
3.8% | 2806 | $500,000 | $477,000 | $590 | 1/1½ | 808 s.f. | 7/27/2020 | |
900.0% | 2104 | $549,000 | $510,000 | $631 | 1/1½ | 808 s.f. | 7/13/2020 | |
2.5% | 2205 | $389,900 | $365,000 | $534 | 1/1½ | 683 s.f. | 7/9/2020 | |
1111 | $550,000 | $450,000 | $557 | 1/1½ | 808 s.f. | 6/22/2020 | ||
18.8% | 807 | $690,000 | $620,000 | $469 | 2/2½ | 1322 s.f. | 6/18/2020 | |
3.8% | 905 | $375,000 | $360,000 | $527 | 1/1½ | 683 s.f. | 6/11/2020 | |
1805 | $369,000 | $361,000 | $529 | 1/1½ | 683 s.f. | 5/29/2020 | ||
3411 | $750,000 | $750,000 | $652 | 2/2½ | 1151 s.f. | 4/24/2020 | ||
5.5% | 2204 | $500,000 | $500,000 | $619 | 1/1½ | 808 s.f. | 2/18/2020 | |
2507 | $995,000 | $880,000 | $666 | 2/2½ | 1322 s.f. | 12/10/2019 | ||
3103 | $1,750,000 | $1,450,000 | $823 | 3/2½ | 1761 s.f. | 12/6/2019 | ||
901 | $1,249,000 | $1,150,000 | $653 | 3/2½ | 1761 s.f. | 12/4/2019 | ||
2305 | $449,900 | $395,000 | $578 | 1/1½ | 683 s.f. | 11/22/2019 | ||
3603 | $1,550,000 | $1,466,000 | $832 | 3/2½ | 1761 s.f. | 11/1/2019 | ||
3.3% | 2101 | $1,499,000 | $1,377,500 | $782 | 3/2½ | 1761 s.f. | 10/21/2019 | |
7.4% | 2610 | $415,000 | $395,000 | $578 | 1/1½ | 683 s.f. | 10/15/2019 | |
2102 | $1,100,000 | $1,040,000 | $747 | 2/2 | 1392 s.f. | 9/16/2019 | ||
14.7% | 2207 | $849,000 | $800,000 | $605 | 2/2½ | 1322 s.f. | 8/14/2019 | |
6.4% | 2806 | $398,000 | $426,300 | $528 | 1/1½ | 808 s.f. | 7/31/2019 | |
3311 | $745,000 | $720,077 | $626 | 2/2½ | 1151 s.f. | 7/23/2019 | ||
3704 | $798,000 | $735,000 | $639 | 2/2½ | 1151 s.f. | 6/14/2019 | ||
2.6% | 1610 | $409,000 | $390,000 | $571 | 1/1½ | 683 s.f. | 6/5/2019 | |
3.0% | 4106 | $749,000 | $690,000 | $599 | 2/2½ | 1151 s.f. | 5/22/2019 | |
2.1% | 811 | $476,000 | $440,000 | $545 | 1/1½ | 808 s.f. | 5/10/2019 | |
3.1% | 1903 | $1,599,000 | $1,425,000 | $809 | 3/2½ | 1761 s.f. | 4/25/2019 | |
3.5% | 2301 | $1,399,900 | $1,300,000 | $738 | 3/2½ | 1761 s.f. | 4/5/2019 | |
4.1% | 4006 | $695,000 | $650,000 | $565 | 2/2½ | 1151 s.f. | 2/28/2019 | |
1407 | $730,000 | $603,750 | $457 | 2/2½ | 1322 s.f. | 2/27/2019 | ||
0.3% | 4203 | $1,690,000 | $1,410,000 | $801 | 3/2½ | 1761 s.f. | 2/25/2019 | |
2408 | $849,000 | $800,000 | $605 | 2/2½ | 1322 s.f. | 2/14/2019 | ||
7.3% | 3606 | $820,000 | $750,000 | $652 | 2/2½ | 1151 s.f. | 1/18/2019 | |
0.5% | 908 | $799,000 | $725,000 | $548 | 2/2½ | 1322 s.f. | 12/28/2018 | |
2704 | $585,000 | $552,500 | $684 | 1/1½ | 808 s.f. | 12/19/2018 | ||
4109 | $775,000 | $700,000 | $608 | 1/2½ | 1151 s.f. | 12/18/2018 | ||
3.5% | 4003 | $1,699,000 | $1,550,000 | $880 | 3/2½ | 1761 s.f. | 12/7/2018 | |
2701 | $1,849,000 | $1,650,000 | $937 | 3/2½ | 1761 s.f. | 11/5/2018 | ||
Zilbert | TS-02 | $2,995,000 | $2,450,000 | $882 | 3/4½ | 2777 s.f. | 10/1/2018 | |
4.3% | 1710 | $440,000 | $410,000 | $600 | 1/1½ | 683 s.f. | 10/1/2018 | |
13.7% | 1504 | $430,000 | $395,000 | $489 | 1/1½ | 808 s.f. | 9/12/2018 | |
4306 | $798,000 | $755,000 | $656 | 1/2½ | 1151 s.f. | 8/31/2018 | ||
1.2% | 905 | $400,000 | $385,000 | $564 | 1/1½ | 683 s.f. | 8/2/2018 | |
90.0% | 2202 | $1,085,000 | $1,050,001 | $754 | 2/2 | 1392 s.f. | 7/25/2018 | |
3506 | $795,000 | $785,000 | $682 | 2/2½ | 1151 s.f. | 7/16/2018 | ||
4.1% | 2907 | $1,199,000 | $1,040,000 | $787 | 2/2½ | 1322 s.f. | 7/2/2018 | |
3001 | $1,849,000 | $1,585,000 | $900 | 3/2½ | 1761 s.f. | 5/22/2018 | ||
2402 | $1,125,000 | $1,125,000 | $808 | 2/2½ | 1392 s.f. | 4/16/2018 | ||
5.5% | TS-06 | $1,890,000 | $1,750,000 | $709 | 2/2½ | 2470 s.f. | 3/23/2018 | |
3201 | $1,599,000 | $1,450,000 | $823 | 3/2½ | 1761 s.f. | 1/5/2018 |
The available condo data in this report is limited to properties for sale at $350,000 and higher, and properties for rent at $5,000 and higher. Less expensive properties may not be appearing on this site.
Source: Southeast Florida MLS. Data updated 12/9/2024. Information is deemed reliable but not guaranteed. The listing data on this page comes from the Internet Data Exchange (IDX), a collaboration between the REALTOR(R) associations in the South Florida Multiple Listing Service (MLS) including The Miami Association of Realtors and Beaches MLS. All rights reserved. A property appearing on this website is not necessarily an exclusive listing of Zilbert, and may be listed with other brokers. An agent of Zilbert appearing on this website as the contact person for any property is not necessarily the listing agent, however, is acting at a transaction broker. The name of the listing broker appears with every property detail page, shown just after the map. When properties are presented as part of lists, generally the Zilbert listings for Miami Beach are highlighted in yellow. The information being provided is for consumers' personal, non-commercial use. Federal law prohibits discrimination on the basis of race, color, religion, sex, handicap, familial status or national origin in the sale, rental or financing of housing.
Mark Zilbert recommends that buyers, sellers and renters of real estate consult appropriate professionals for legal and other specialized advice.
Information presented on this website is believed to be accurate but is not warranted. Oral representations should not be considered valid. Information presented on this site (and in generated reports) may contain listings from both Zilbert and other brokers who cooperate with Zilbert. The content on this webpage (including drawings, photos, text and other materials) may have been provided by developers, third parties or others, and may have been extracted from a developer's marketing materials. Zilbert does not warrant the accuracy of such information. You should consult your Purchase Agreement, Contract and Condominium Documents for accurate information. Zilbert is an independent broker and has no developer affiliation, unless otherwise noted.